
|
MiScout SCADA Desk makes it possible for a user to generate a Power Curve graph for selected unit(s) over a pre-defined time period. User can filter data which should be included/excluded from the estimation using the Custom Generated Log Properties form described further in this section.
Power curve calculation for both pitch-regulated and stall-regulated wind turbines is based on one and the same formula independent of the turbine type. However, normalization is required, if a user would like to compare power curves retrieved from wind turbines working under different environmental conditions (e.g. at different air density levels).
In this case, the formula for calculating normalization differs, as for pitch-regulated turbines wind speed normalization has to be calculated, while for the stall-regulated turbines power normalization is required.
Note. Normally, wind turbines usually operate under different environmental conditions, which effect their production efficiency - i.e. high air density results in high production, whereas low levels of air density result in low production.
Pitch-regulated wind turbines
WIND SPEED NORMALIZATION
The formula for calculating normalized wind speed value for the pitch-regulated wind turbines is as follows:

Where:
![]() - is wind speed value taken from the Average Log (5/10 min log);
- is wind speed value taken from the Average Log (5/10 min log);
![]() - denotes the air density measured at Nacelle top point;
- denotes the air density measured at Nacelle top point;
![]() - is air density measured at sea level. Usually, the value of air density is equal to 1,225.
- is air density measured at sea level. Usually, the value of air density is equal to 1,225.
Stall-regulated wind turbines
POWER NORMALIZATION
The formula for calculating normalized power value for the stall-regulated wind turbines is as follows:

Where
![]() - denotes the air density measured at Nacelle top point;
- denotes the air density measured at Nacelle top point;
![]() - is air density measured at sea level. Usually, the value of air density is equal to 1,225;
- is air density measured at sea level. Usually, the value of air density is equal to 1,225;
![]() - is power value taken from the Average Log (5/10 min log).
- is power value taken from the Average Log (5/10 min log).
AIR DENSITY CALCULATION
In case wind turbines do not return values for the air density, its value is calculated based on the following formula

Where:
![]() – is air pressure value in Pascals (Pa). The pressure value normally used equals to 101325 Pa;
– is air pressure value in Pascals (Pa). The pressure value normally used equals to 101325 Pa;
![]() - ambient temperature value in K (+273,15) retrieved form the Average Log (5/10 min log);
- ambient temperature value in K (+273,15) retrieved form the Average Log (5/10 min log);
![]() – is gas constant of dry air. Normally, its value is equal to 287,05.
– is gas constant of dry air. Normally, its value is equal to 287,05.
Please keep in mind, that the air pressure value required for the calculation has to be measured at the top of Nacelle. Thus, air pressure at Nacelle top is calculated based on the following formula:

Where:
101325 - is normal air pressure value in Pascals (Pa);
![]() - is the turbine Nacelle height in meters (m).
- is the turbine Nacelle height in meters (m).
12 - is the air pressure value in Pascals (Pa). Total value of the wind turbine height has to be multiplied by 12, as each meter of the tower height reduces the air pressure by 12 Pa.
Based on the above mentioned, the air density formula is transformed into the following:

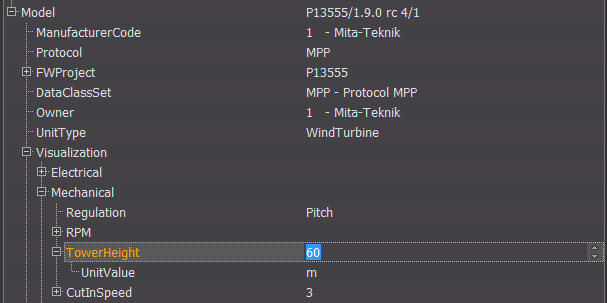
Nacelle height of the wind turbine is specified for each specific controller in Controller Configuration, as shown in the screen below.
To have access to the Power Curve tab, the Summations Logs Browser (mtplSummations.bpl) plug-in must be already listed in the Plugin Configuration dialog.
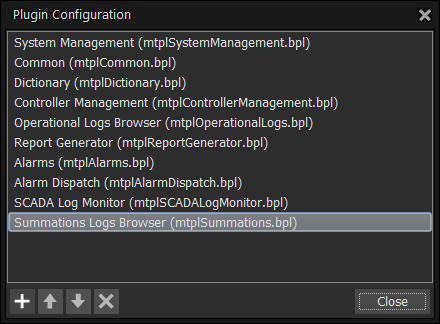
If the required plug-in is available, the Power Curve tab will appear on the main application ribbon. In case the required plug-in is not on the list, you can easily upload it. For more detail information, refer to Configuring Plug-ins.
As soon as the required plug-in has been loaded, the Power Curve tab appears on the main application ribbon. Therefore, after clicking the Power Curve tab on the main ribbon, a user can access the toolbar.

By selecting the Show/Hide check-boxes, a user can customize visual settings on the graph.
1. Click the Power Curve tab on the ribbon to access its toolbar:

2. In the Controller View panel to the right select a required unit, by selecting the corresponding check-box.
3. Next, click the  New icon found in the Window section of the toolbar. As a result, the Power Curve Browser window will reveal within the main monitoring area.
4. Afterwards, press the  Power Curve icon in the Logs section on the toolbar. As a result, communication with the unit will be established and data will be retrieved from the Status log and Average log. Further on, information provided by these logs will be taken into account for power curve calculation. Besides, the Communication Log tab will appear at the bottom of the main monitoring area.
Note. The log information will be downloaded depending on the Data Source settings made in the Appearance tab - i.e. Database only or Along with online.
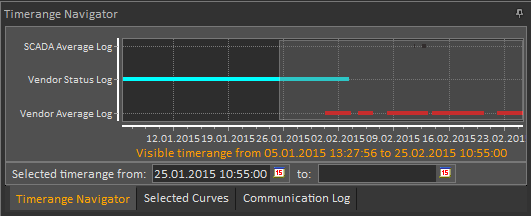
5. Click the Timerange Navigator tab to open it and specify the time period for which you'd like to build the power curve. Therefore, click  to open a pop-up calendar and specify the desired time period in the from and to fields.
6. Click the  Calculate button to configure data setting for a power curve you're going to generate.
As a result, the Custom Generated Log Properties form appears. By default, most fields are set to <auto> for fast and uncomplicated generation of the Power Curve (if a user selects one of available channel sets pre-configured in MiScout for the power curve). This form may be used by those users who would like to create their own power curve configuration by specifying the channels and entering information in the property fields.
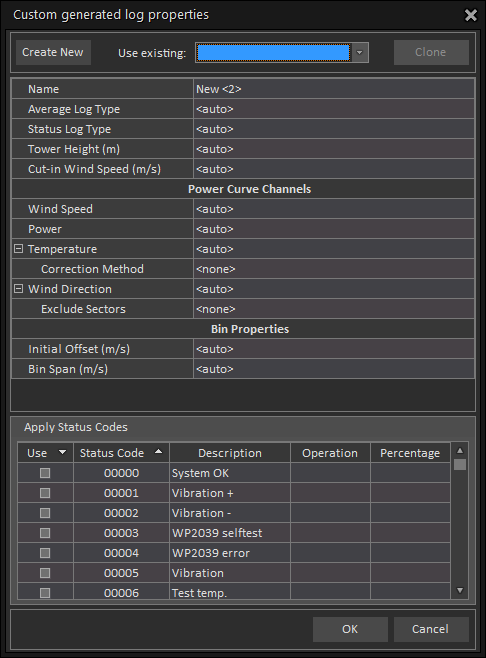
To start a new configuration, click Create New or Clone to copy current logs properties configuration to a new one.
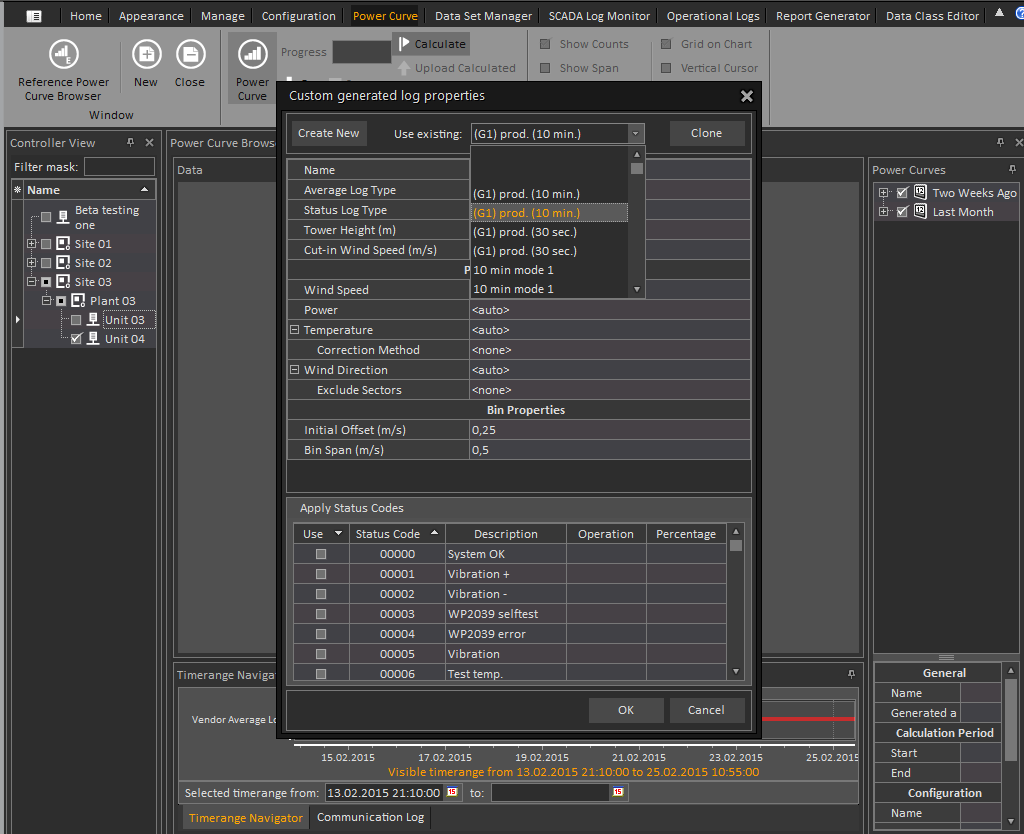
In Use Existing Field from drop-down list user can select pre-configured sets of log properties (e.g. power curve channels and other properties). And click OK to generate power curve according to selected configuration without filling in rest property fields.
If Use Existing Field is left blank, then user creates his own log properties configuration and filtering of data for power curve, and therefore needs to fill in the Custom Generated Log Properties fields, which are the following:
Power Curve Channels - select available channels from the list corresponding to:
The channels which appear in the list correspond to the Data Source which have been previously selected.
Correction Method - specify power curve correction method (Stall or Pitch regulated);
Exclude Sectors - enter number(s) sectors (from 1 to 12) of wind direction which you want to exclude from generated power curve. If you'd like to exclude more than one sector, separate their number by a semicolon ";" or by a colon ':' if you want to execute the sequence of sectors (from and to).
Initial Offset - enter the value of offset from zero, which is used for better representation of data (normally it is 0,5).
Bin Span - enter value of interval with which data will be aggregated into groups and displayed in bins.
Apply Status Codes - in the list user can specify to exclude or include log data, when the selected status code has been set. Select appropriate in Operation field.
Percentage - filters the data by percentage of status code set period in log data. It will take into account only the data, when status code was set for time equal or more than indicated.

After clicking OK, the generated Power Curve will appear. As you can see, the power curve can be displayed as a line, bars or stairs.
After the curve is generated user can upload it and save to the Database as an image by clicking Upload Calculated. Consequently it will appear on Power Curves panel on the right.
If user wants to compare calculated power curve with the one from data base, he needs to check appropriate check-box next to the channel on Power Curve panel and then click  button to open this power curve.
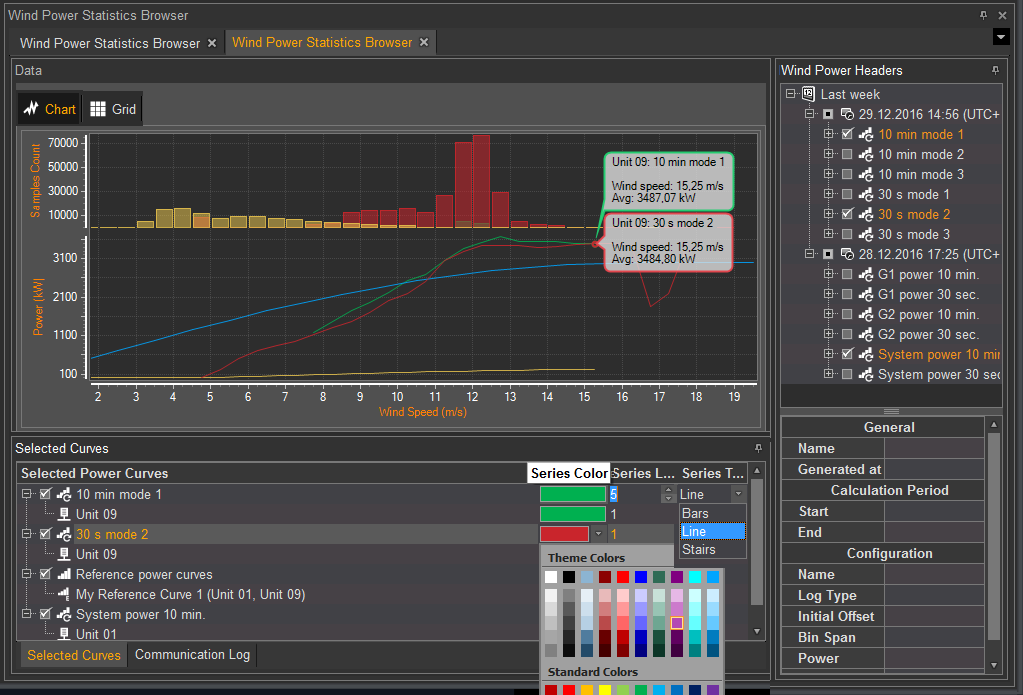
To have the power curve data presented as a table, click the Grid icon. You can easily switch between the data presentation modes by clicking the corresponding icons.

As a result, the power curve data is presented in a tabular format.

User can also change the color scheme in which power curve is generated.
Viewing and saving log data as an Excel (.xls) file
For user's convenience, all controller data shown in the log can be viewed and saved as an Excel (.xls) file. For more detail instructions, refer to Viewing and saving log data as an Excel (.xls) file described in Vendor Standard Average Log.
Reference Power Curve Browser
 Click this button to open the Reference Power Curve browser. From this browser user can create reference power curve for particular unit according to it production capability.
On the bottom of the screen specify configuration settings for a new reference power curve:
- Name - enter the name for the reference power curve;
- Display factor - select display factor for the power measuring units (W, kW, MW);
- Bins Count - specify the number of bins to which the power curve will be split;
- Bin Span - enter value of interval in m/s with which data will be aggregated into groups and displayed in bins;
- Initial Offset - enter the value of offset from zero, which is used for better representation of data;
- Max Power - specify the maximum power value for the curve.
Clone - creates new reference power curve with current settings;
New - creates new reference power curve with empty configuration;
Delete - deletes currently viewed reference power curve;
Generate - generates reference power curve according to the configuration settings.
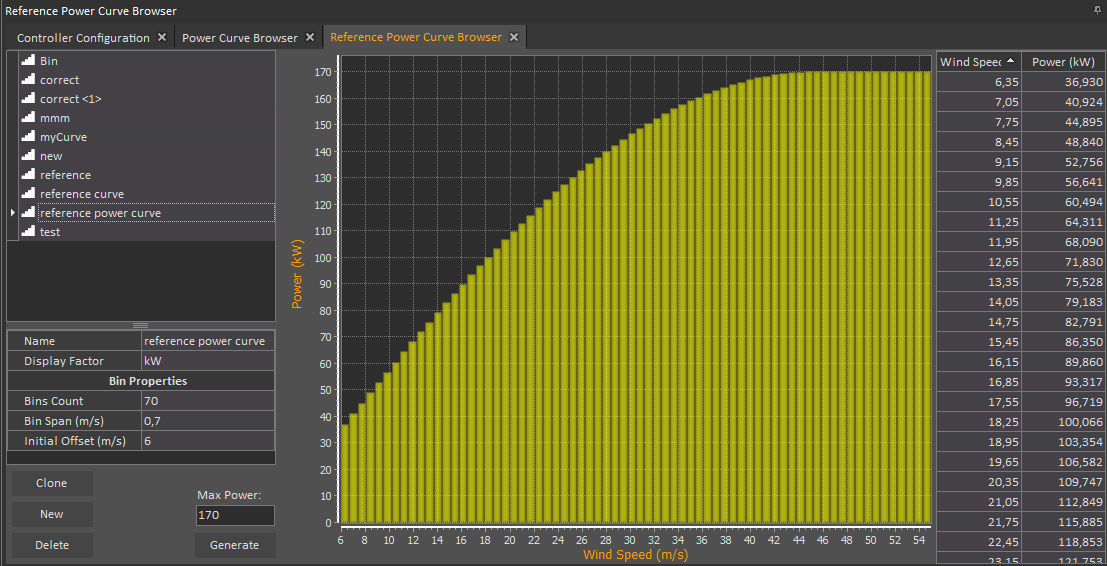
After the power curve was generated user needs to assign it to selected unit to be able to later compare power curve from turbine with reference power curve which is model power curve for the unit.
Assigning a reference power curve in Controller Configuration
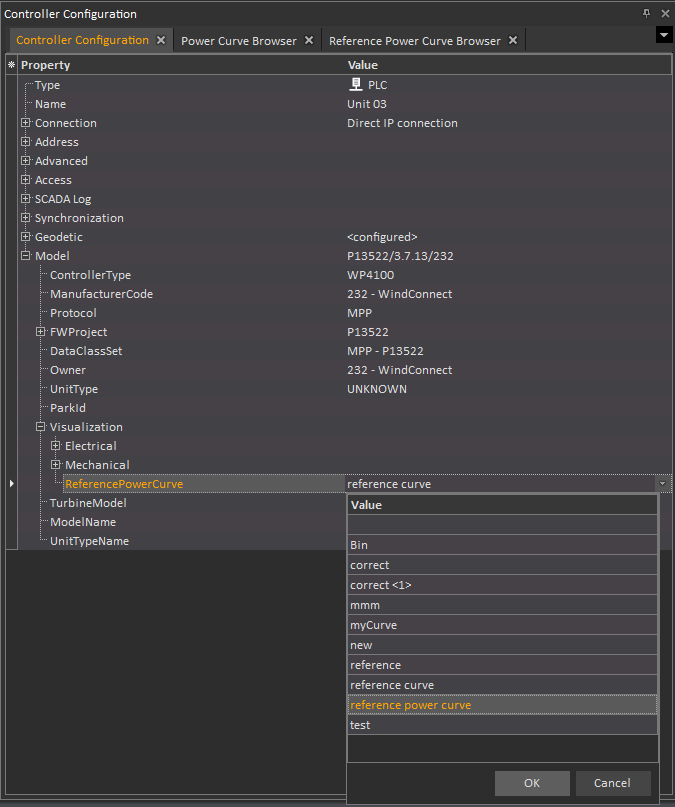
In Controller View tick the unit to which you want to assign the reference power curve to. Right-click on the unit and select Properties. Controller Configuration window opens. Go to Model node ->Visualization->ReferencePowerCurve and from drop-down list select reference power curve which was created for this unit.
